Kawasaki resale condo prices fell 7.3% year on year per square meter. Did they really drop? (Reading the August 2026 data)
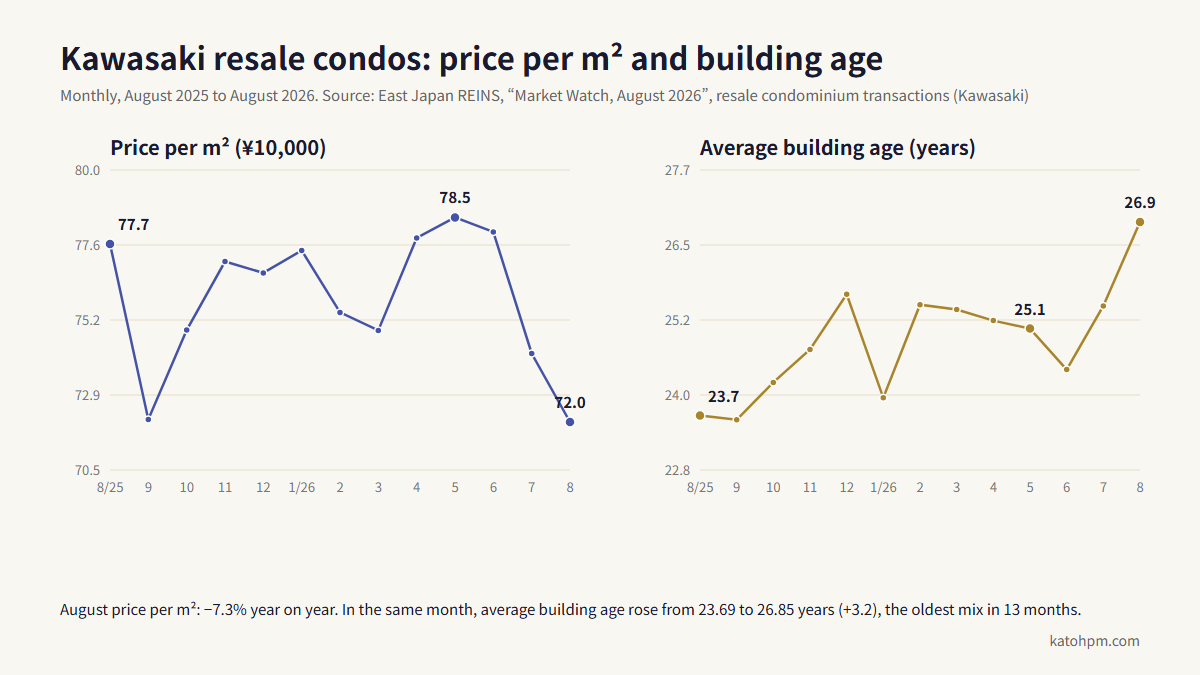
According to East Japan REINS data for August 2026, the average closed price per square meter of resale condominiums in Kawasaki was ¥720,200, down ¥56,400 from a year earlier. In the same month, however, the average building age rose by more than three years and crossed the 25-year mark. Using age-band data for the greater Tokyo area, a comparison with two years ago, and comparisons with the greater Tokyo area as a whole, eastern Tokyo and Yokohama, this article explains how to read the figure.
Units: Japanese statistics express prices in 万円 (units of ¥10,000). In this article, ¥720,200 per square meter corresponds to 72.02万円 in the Japanese original.
Did condo prices in Kawasaki really fall 7%?
As an average, yes, but the figure mixes a genuine price change with a change in which properties sold. August 2026 was a month in which many older condominiums changed hands, and the average building age crossed the 25-year mark. That alone pulls the average price per square meter down considerably.
On social media, the figure was taken as “central Tokyo keeps rising while Kawasaki is down 7–8% year on year”. The source is Market Watch, the monthly bulletin published by the East Japan Real Estate Information Network (East Japan REINS, 東日本不動産流通機構). This article uses the same table, together with REINS data by building age, to look step by step at what fell and what changed.
What were Kawasaki’s figures for August 2026?
The closed price per square meter was ¥720,200, down ¥56,400 from ¥776,600 a year earlier. The average price was ¥47.77 million, down ¥3.11 million, and the number of closed transactions was 194, unchanged. Meanwhile, the average building age was 26.85 years, 3.16 years older than the 23.69 years of a year earlier. Average floor area rose by only 0.81 m², not a meaningful difference.
| Item | August 2025 | August 2026 | Year-on-year change |
|---|---|---|---|
| Closed transactions | 194 | 194 | ±0 |
| Price per m² | ¥776,600 | ¥720,200 | −¥56,400 (−7.3%) |
| Average price | ¥50.88 million | ¥47.77 million | −¥3.11 million (−6.1%) |
| Average floor area | 65.52 m² | 66.33 m² | +0.81 m² |
| Average building age | 23.69 years | 26.85 years | +3.16 years |
Source: East Japan REINS, “Market Watch”, August 2026
Can three extra years of building age really move the price by 7%?
Yes. In transaction data for the greater Tokyo area, the price per square meter differs by 25% between buildings aged 21–25 years and 26–30 years, and Kawasaki’s average building age crossed exactly that boundary.
East Japan REINS’s annual report, “The greater Tokyo real estate market by building age (2025)” (築年数から見た首都圏の不動産流通市場), includes a table of resale condominium transactions in the greater Tokyo area by building age band.
| Building age | Price per m² (greater Tokyo, 2025) | Difference from the previous band |
|---|---|---|
| 16–20 years | ¥991,300 | |
| 21–25 years | ¥861,000 | −¥130,300 |
| 26–30 years | ¥644,500 | −¥216,500 (−25.1%) |
| 31–35 years | ¥441,400 | −¥203,100 |
Source: East Japan REINS, “The greater Tokyo real estate market by building age (2025)”
The relationship between building age and price is not a straight line; there are large steps around 25 years and around 30 years. These are the ages at which the new seismic standards, the requirements for Japan’s mortgage tax deduction and the timing of major repair work tend to overlap, which likely changes how buyers see a property. (Identifying the causes is outside the scope of the report.)
The average age of the condominiums sold in Kawasaki moved from 23.69 to 26.85 years in August 2026. That is equivalent to going from “a month centered on 21–25-year-old buildings” to “a month centered on 26–30-year-old buildings”. Applying the greater Tokyo age-band data directly, that shift in mix could have lowered the average price by more than 20%. The actual decline stopped at ¥56,400 (−7.3%), so once the change in building age is set aside, Kawasaki’s price level can be read as roughly unchanged from a year earlier, or even firm. Applying the greater Tokyo average to Kawasaki is only a rough guide, of course, and the size of the step differs by property and location. But it is worth keeping in mind that three years of building age is not a small difference for the price per square meter.
Why was August 2025 so high?
Three facts can be confirmed, and all of them pushed the August 2025 price up. No single reason can be identified.
- August 2024 was a weak month. In August 2024, Kawasaki had 123 closed transactions at ¥726,200 per square meter. August 2025 had 194 at ¥776,600: 71 more transactions and ¥50,400 higher per square meter. The 57.7% jump in transactions reflects how low the base was.
- The greater Tokyo area as a whole was strong that month. In August 2025, the greater Tokyo area recorded 3,553 closed transactions (+54.5% year on year) at ¥848,500 per square meter (+13.5%); prices rose on the strength of the market as a whole.
- Many younger condominiums sold that month. Kawasaki’s average building age in August 2025 was 23.69 years, the second youngest mix in the 13 months. As the previous section showed, months with younger buildings have higher average prices.
Lining up August 2024, August 2025 and August 2026, the price per square meter was ¥726,200, ¥776,600 and ¥720,200. The price is back to roughly where it was two years ago, but over that period the average building age rose by more than five years, from 21.63 to 26.85 years. Compared at the same building age, it is natural to see prices as higher than two years ago.
How does Kawasaki compare with the greater Tokyo area, Tokyo and Yokohama?
For the greater Tokyo area as a whole, the price per square meter also fell ¥32,500 year on year, and the average building age rose by about two years. Kawasaki shows the same trend more strongly.
| Area | Price per m² | Year-on-year change | Average building age | Age change | Change in transactions |
|---|---|---|---|---|---|
| Greater Tokyo area | ¥816,000 | −¥32,500 | 28.29 years | +2.01 years | −373 |
| Tokyo, central 3 wards | ¥2,468,100 | +¥97,200 | 22.91 years | +2.49 years | −98 |
| Tokyo, Joto district (east) | ¥1,006,600 | +¥23,000 | 25.17 years | +2.03 years | −94 |
| Yokohama, Kanagawa | ¥629,000 | +¥21,200 | 29.50 years | +1.48 years | −13 |
| Kawasaki, Kanagawa | ¥720,200 | −¥56,400 | 26.85 years | +3.16 years | ±0 |
Source: East Japan REINS, “Market Watch”, August 2026
Prices rose in the Joto district and Yokohama, but closed transactions fell by 94 in the Joto district and 98 in the central 3 wards. When transaction numbers fall, the average price is more easily moved by which properties happen to sell. In Kawasaki, the number of transactions was unchanged, so the rise in the share of older properties can be read as showing up plainly in the average. Yokohama already had an older mix, at an average of 29.50 years, and a smaller change in building age, so its price moved more gently.
How should people thinking of selling or buying read this?
Use the citywide monthly average as a rough guide to direction, and judge your own property with data narrowed down by building age, area and floor area.
- If you are thinking of selling: a drop in one month’s average is no reason to rush into cutting your price. Start by looking at closed transactions for the same building age band near the same station as your condominium. For buildings around 20 years old in particular, buyers see a property differently before and after it passes the 25-year mark, which is useful for deciding when to list. In our valuations, we narrow down the public transaction price data released by the Ministry of Land, Infrastructure, Transport and Tourism by building age and area, and show you the underlying data as it is.
- If you are thinking of buying: a month with a lower average price is also a month in which many older properties came on the market. Newer buildings and buildings close to the station have not necessarily fallen at the same rate. Conversely, condominiums over 25 years old are cheaper by the size of the step, so they are worth considering once you have checked the repair history and the state of the building’s management.
- For both: the East Japan REINS monthly data is suited to seeing direction, and the ministry’s quarterly data is suited to looking at conditions close to an individual property. We use both together.
How will we keep track from here?
We will check the East Japan REINS monthly data every month, and each quarter we will organize the movement by station and building age in Kawasaki and Yokohama using the ministry’s transaction price data.
This blog will cover the Kawasaki resale condominium market regularly. Articles looking at Musashikosugi, the Tokyu Toyoko line neighborhoods, and the tower condominiums of Kawasaki and Yokohama by station and building age, based on public data, will follow. For help with selling or buying, see our pages for sellers and buyers.
Sources: East Japan Real Estate Information Network, “Market Watch” (monthly bulletin) and “The greater Tokyo real estate market by building age (2025)”. Year-on-year differences are our own calculations. The figures cover closed transactions only, so they do not match the price movement of any individual property. Yen amounts are converted from the 万円 figures in the source (72.02万円 = ¥720,200). This English article is a translation for reference; the Japanese version is the original.