Have Musashikosugi resale condos overtaken Tokyo's 23 wards? Price per square meter up 1.5 times in four years
According to transaction price data from Japan's Ministry of Land, Infrastructure, Transport and Tourism, the median closed price per square meter of resale condominiums built in 2005 or later around Musashikosugi Station rose from ¥973,000 in 2021 to ¥1,500,000 in 2025, up 54% in four years. Under the same conditions, the Kawasaki Station area rose 25%, Kawasaki City as a whole 29%, the greater Tokyo area (Tokyo and three neighboring prefectures) 34%, and Tokyo's 23 wards 38%; Musashikosugi overtook the 23-ward median in 2024. Using public data, this article looks at the share of sales above ¥100 million, a comparison with building age held constant, and the caveats of the method.
Units: Japanese statistics express prices in 万円 (units of ¥10,000). In this article, ¥1,500,000 per square meter corresponds to 150.0万円 in the Japanese original.
We are a real estate company with an office in Nakahara Ward, Kawasaki, and we often receive inquiries about selling and buying properties in Kawasaki, starting with Musashikosugi. One of the most common questions is how much Musashikosugi condominiums have gone up over the past few years. We looked into the statistics using public data.
How much have resale condominium prices in Musashikosugi risen since 2021?
The median closed price per square meter of resale condominiums built in 2005 or later rose from ¥973,000 in 2021 to ¥1,500,000 in 2025, up ¥527,000 (54%) in four years. For a 70 m² unit, that is roughly ¥68 million becoming about ¥105 million.
For this article, we compiled the transaction price data published in the Real Estate Information Library (不動産情報ライブラリ) of the Ministry of Land, Infrastructure, Transport and Tourism (MLIT). The data covers prices of transactions actually closed through real estate agents, so these are prices at which properties sold, not asking prices. We define the “Musashikosugi Station area” as the five districts of Nakahara Ward where Musashikosugi’s tower condominiums are concentrated (Kosugi-cho, Shinmaruko-higashi, Nakamaruko, Marukodori and Imai-minamicho), and limit the data to buildings from 2005 or later, the period when the towers were being completed.
| Year | Closed sales | Price per m² (median) | Change from previous year |
|---|---|---|---|
| 2021 | 135 | ¥973,000 | |
| 2022 | 152 | ¥1,042,000 | +¥69,000 (+7.1%) |
| 2023 | 146 | ¥1,120,000 | +¥78,000 (+7.5%) |
| 2024 | 158 | ¥1,267,000 | +¥147,000 (+13.1%) |
| 2025 | 196 | ¥1,500,000 | +¥233,000 (+18.4%) |
Source: compiled by us from the MLIT Real Estate Information Library (contract price data). Resale condominiums built in 2005 or later, Musashikosugi Station area
The pace of increase has grown each year. Prices rose by ¥70,000–80,000 a year (around 7%) in 2022 and 2023, then by ¥147,000 (13.1%) in 2024 and ¥233,000 (18.4%) in 2025. The number of closed sales in 2025 was 196, the highest of the five years.
How does this compare with the Kawasaki Station area, Kawasaki City and the greater Tokyo area?
Comparing buildings from 2005 or later, prices rose 25% over the four years in the Kawasaki Station area, 29% in Kawasaki City as a whole and 34% in the greater Tokyo area. Musashikosugi’s 54% is roughly double the Kawasaki comparisons and 1.6 times the greater Tokyo area. In 2021, Musashikosugi was only about 6% above the Kawasaki Station area; by 2025 the gap had widened to about 31%.
| Area | 2021 | 2025 | Change over four years |
|---|---|---|---|
| Musashikosugi Station area | ¥973,000 (135 sales) | ¥1,500,000 (196 sales) | +¥527,000 (+54%) |
| Kawasaki Station area | ¥920,000 (54 sales) | ¥1,146,000 (76 sales) | +¥226,000 (+25%) |
| Kawasaki City as a whole | ¥700,000 (955 sales) | ¥900,000 (1,153 sales) | +¥200,000 (+29%) |
| Greater Tokyo area (Tokyo and three prefectures) | ¥720,000 (14,685 sales) | ¥967,000 (19,681 sales) | +¥247,000 (+34%) |
Source: as above. Median closed price per square meter of resale condominiums built in 2005 or later
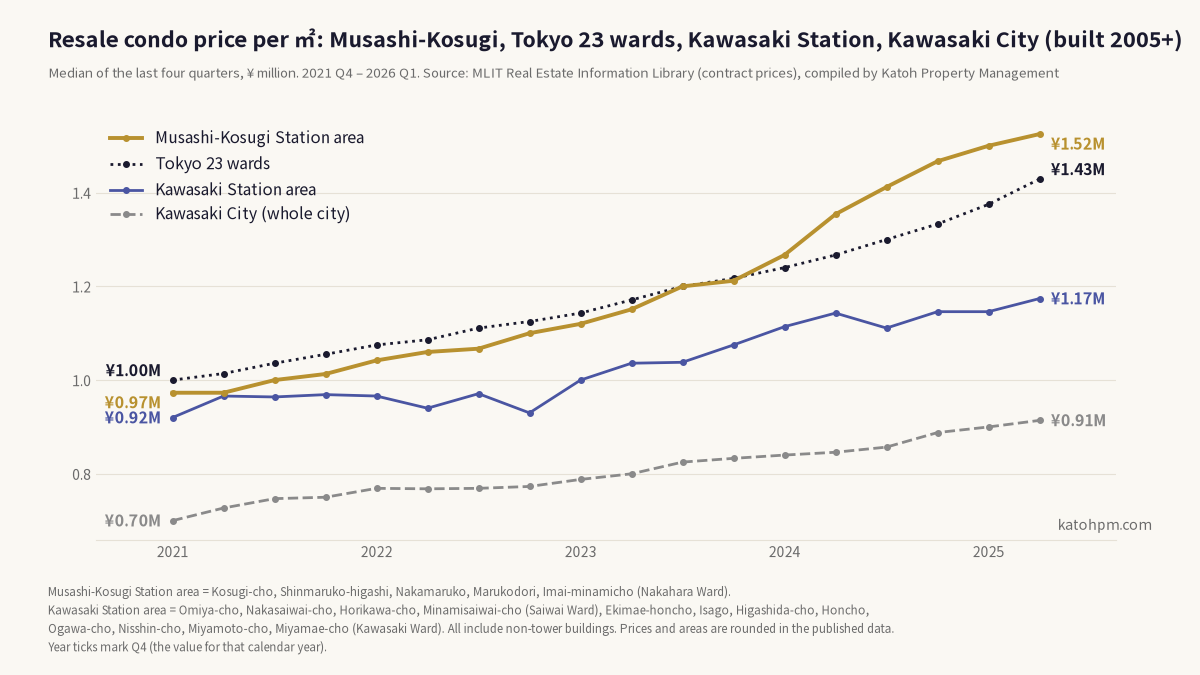
The Kawasaki Station area combines Omiya-cho, Nakasaiwai-cho, Horikawa-cho and Minamisaiwai-cho in Saiwai Ward and Ekimae-honcho, Isago, Higashida-cho, Honcho, Ogawa-cho, Nisshin-cho, Miyamoto-cho and Miyamae-cho in Kawasaki Ward, on both sides of JR Kawasaki Station. It is the other cluster of tower condominiums in Kawasaki, and in 2021 it was at almost the same level as Musashikosugi.
On the chart, the two areas moved almost together until around 2022, and from 2023 only Musashikosugi changed its angle and climbed. The Kawasaki Station area has kept rising too, but at a slope not very different from Kawasaki City as a whole. The dotted line for Tokyo’s 23 wards is covered in the next section.
For the most recent year (Q2 2025 to Q1 2026), the Musashikosugi Station area was ¥1,525,000 (188 sales), the Kawasaki Station area ¥1,174,000 (76 sales), Kawasaki City as a whole ¥914,000 (1,151 sales) and the greater Tokyo area ¥987,000 (19,676 sales).
How does Musashikosugi compare with Tokyo’s 23 wards?
The Musashikosugi Station area was ¥20,000–30,000 below the median for Tokyo’s 23 wards until 2023, then overtook it in 2024. In 2025 it stood at ¥1,500,000, ¥125,000 above the 23 wards’ ¥1,375,000. Over the four years, the 23 wards rose 38% and Musashikosugi 54%.
| Year | Musashikosugi Station area | Tokyo 23 wards | Difference |
|---|---|---|---|
| 2021 | ¥973,000 (135 sales) | ¥1,000,000 (7,128 sales) | −¥27,000 |
| 2022 | ¥1,042,000 (152 sales) | ¥1,075,000 (7,486 sales) | −¥33,000 |
| 2023 | ¥1,120,000 (146 sales) | ¥1,143,000 (7,856 sales) | −¥23,000 |
| 2024 | ¥1,267,000 (158 sales) | ¥1,240,000 (7,984 sales) | +¥27,000 |
| 2025 | ¥1,500,000 (196 sales) | ¥1,375,000 (10,136 sales) | +¥125,000 |
Source: as above. Median closed price per square meter of resale condominiums built in 2005 or later. Tokyo 23 wards covers all of the special wards
In 2021 the two started from almost the same point: ¥973,000 for Musashikosugi and ¥1,000,000 for the 23 wards. On the chart, the Musashikosugi line runs just below the 23 wards until mid-2024. After that, the 23 wards also picked up pace, but Musashikosugi climbed at a steeper angle and the gap widened. For the most recent year, Musashikosugi was ¥1,525,000 and the 23 wards ¥1,429,000 (9,991 sales).
The 23-ward median includes everything from expensive properties in central Tokyo to properties far from stations and in the more suburban wards. The Musashikosugi Station area is centered on tower condominiums close to the station, so the locations are not like for like. Even so, overtaking the 23 wards on the “middle price” of condominiums built in 2005 or later shows that Musashikosugi’s price range has moved above that of an average property in Tokyo.
How many sales in Musashikosugi are now above ¥100 million?
Sales of ¥100 million or more went from 1% in 2021 to 60% in 2025. The median sale price rose from ¥71 million to ¥110 million, and ¥100 million has become the norm for Musashikosugi condominiums up to around 20 years old.
| Year | Median sale price | Share at ¥100 million or more |
|---|---|---|
| 2021 | ¥71 million | 1% |
| 2022 | ¥72 million | 2% |
| 2023 | ¥80 million | 8% |
| 2024 | ¥90 million | 25% |
| 2025 | ¥110 million | 60% |
Source: as above. Resale condominiums built in 2005 or later, Musashikosugi Station area
In the Kawasaki Station area in 2025, the median sale price was ¥59.5 million and 14% of sales were ¥100 million or more. The median floor area of units sold there was 55 m², smaller than Musashikosugi’s 75 m², so the gap in total price between the two areas is even larger than the gap in price per square meter.
Isn’t this simply because more new buildings sold?
Even when limited to buildings completed between 2005 and 2014, Musashikosugi’s price per square meter rose 56%. Tokyo’s 23 wards rose 37%, the Kawasaki Station area and the greater Tokyo area 31% each, and Kawasaki City as a whole 26%.
The median completion year of condominiums sold around Musashikosugi Station moved slightly newer, from 2011 in 2021 to 2014 in 2025. Newer buildings command higher prices, so that could make the rise look larger than it is. We therefore recompared using only buildings completed between 2005 and 2014, which have enough sales in both 2021 and the most recent year.
| Area | 2021 | Most recent year | Change |
|---|---|---|---|
| Musashikosugi Station area | ¥923,000 (96 sales) | ¥1,444,000 (109 sales) | +56% |
| Tokyo 23 wards | ¥933,000 (4,592 sales) | ¥1,275,000 (5,047 sales) | +37% |
| Kawasaki Station area | ¥926,000 (33 sales) | ¥1,215,000 (42 sales) | +31% |
| Kawasaki City as a whole | ¥671,000 (661 sales) | ¥843,000 (649 sales) | +26% |
| Greater Tokyo area (Tokyo and three prefectures) | ¥660,000 (9,922 sales) | ¥867,000 (10,245 sales) | +31% |
Source: as above. Median closed price per square meter of resale condominiums built 2005–2014. The most recent year is Q2 2025 to Q1 2026
Because this compares the same group of buildings after they have aged four years, building age pushes prices down. Even so, Musashikosugi rose 56%, meaning the market for the same age band itself went up sharply.
With building age held constant, the Kawasaki Station area and the greater Tokyo area rose by the same 31%. The Kawasaki Station area is rising at almost the same pace as the greater Tokyo market, and only Musashikosugi has broken away from it.
What kind of starting point was 2021?
2021 in Musashikosugi came about a year and a half after flooding around the station caused by the October 2019 typhoon (Typhoon Hagibis). Even so, its price per square meter was already about 6% above the Kawasaki Station area.
In that typhoon, parts of the Musashikosugi Station area were flooded, and it was widely reported that the electrical equipment of one tower condominium was damaged, leaving it without power and water for some time. The Real Estate Information Library’s contract price data is available only from Q1 2021, so a comparison with the period before the typhoon is not possible.
Why has only Musashikosugi risen so sharply?
Commonly cited background factors include rising new and resale condominium prices in Tokyo’s 23 wards spreading to nearby stations, and Musashikosugi’s position as a transfer station between JR (Yokosuka Line, Shonan-Shinjuku Line and Nambu Line) and Tokyu (Toyoko Line and Meguro Line). How much each of these contributes, however, is outside the scope of this analysis. We will continue to compile the data the same way each quarter and report any changes on this blog.
How should people thinking of selling or buying read this?
Use the median for an area as a guide to the direction of the market, and judge an individual unit against closed sales matched for building, floor, orientation and floor area.
- If you are thinking of selling: condominiums built in 2005 or later in Musashikosugi are now in a very different price range from four years ago. If you base your thinking on what you paid four years ago, or on a valuation from a few years back, you may be out of step with the actual market. In our valuations, we narrow down the same MLIT transaction data used in this article by district and building age, and show you the underlying data as it is.
- If you are thinking of buying: dividing simply by the 2025 median price per square meter, ¥100 million buys about 67 m² around Musashikosugi Station and about 87 m² around Kawasaki Station. It is worth comparing the two with your commute and daily life in mind. Conversely, a market that has kept rising will not necessarily keep rising at the same angle, so we recommend planning your mortgage repayments with room to spare, including for higher interest rates.
For help with selling or buying, see our pages for sellers and buyers.
Data and method
We compiled transactions of “resale condominiums, etc.” (中古マンション等) built in 2005 or later in Tokyo, Kanagawa, Chiba and Saitama from the contract price data (Q1 2021 to Q1 2026) in the MLIT Real Estate Information Library.
- Area definitions: Musashikosugi Station area = Kosugi-cho, Shinmaruko-higashi, Nakamaruko, Marukodori and Imai-minamicho in Nakahara Ward, Kawasaki. Kawasaki Station area = Omiya-cho, Nakasaiwai-cho, Horikawa-cho and Minamisaiwai-cho in Saiwai Ward, and Ekimae-honcho, Isago, Higashida-cho, Honcho, Ogawa-cho, Nisshin-cho, Miyamoto-cho and Miyamae-cho in Kawasaki Ward. These are compiled by district (町), and the boundaries are our own judgment. Tokyo 23 wards = all of Tokyo’s special wards. Greater Tokyo area = all of Tokyo, Kanagawa, Chiba and Saitama.
- Relationship to tower condominiums: the contract price data has no fields for number of floors or total units, so tower condominiums cannot be isolated. The Musashikosugi and Kawasaki Station areas are thought to be mainly tower condominiums, but low- and mid-rise buildings are included.
- Price per square meter: the sale price divided by the floor area, taking the median. Sale prices and floor areas are rounded on publication so that individuals cannot be identified, so the price per square meter is approximate.
- Years: each year’s figure combines transactions from Q1 to Q4 of that year. The chart shows the median of the last four quarters, quarter by quarter.
Sources and notes: The figures in this article were compiled and processed by us using the contract price data (API) of the MLIT Real Estate Information Library. This service uses the API of the MLIT Real Estate Information Library, but the currency, accuracy and completeness of the information provided are not guaranteed. The contract price data covers a portion of the transactions closed in the relevant period and does not by itself show price changes across the market as a whole. Yen amounts are converted from the 万円 figures in the source (150.0万円 = ¥1,500,000). This English article is a translation for reference; the Japanese version is the original.