How much have condo, house and land prices risen since before the 2008 financial crisis? (Tokyo, Yokohama, Kawasaki)
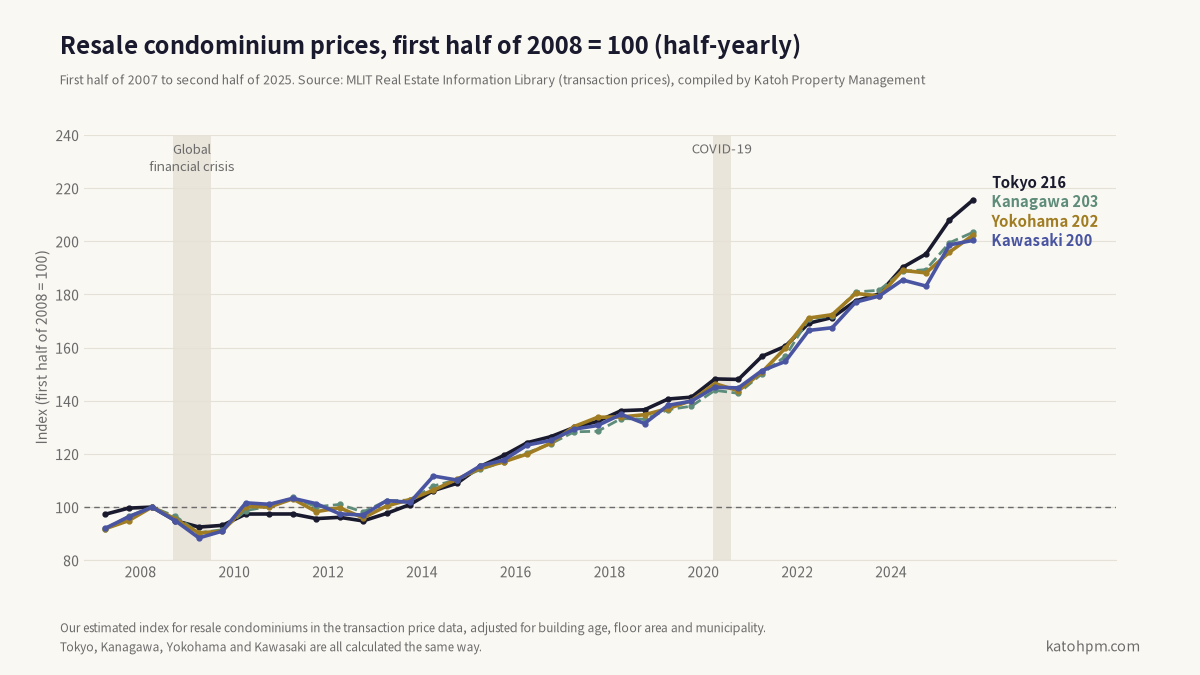
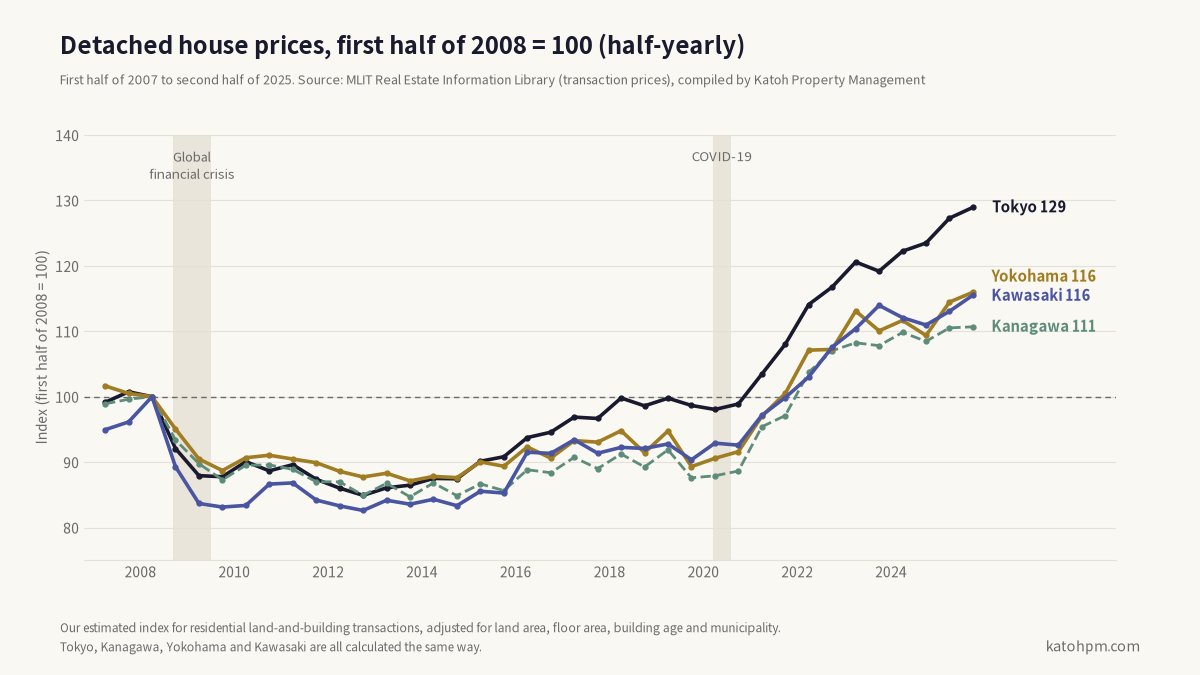
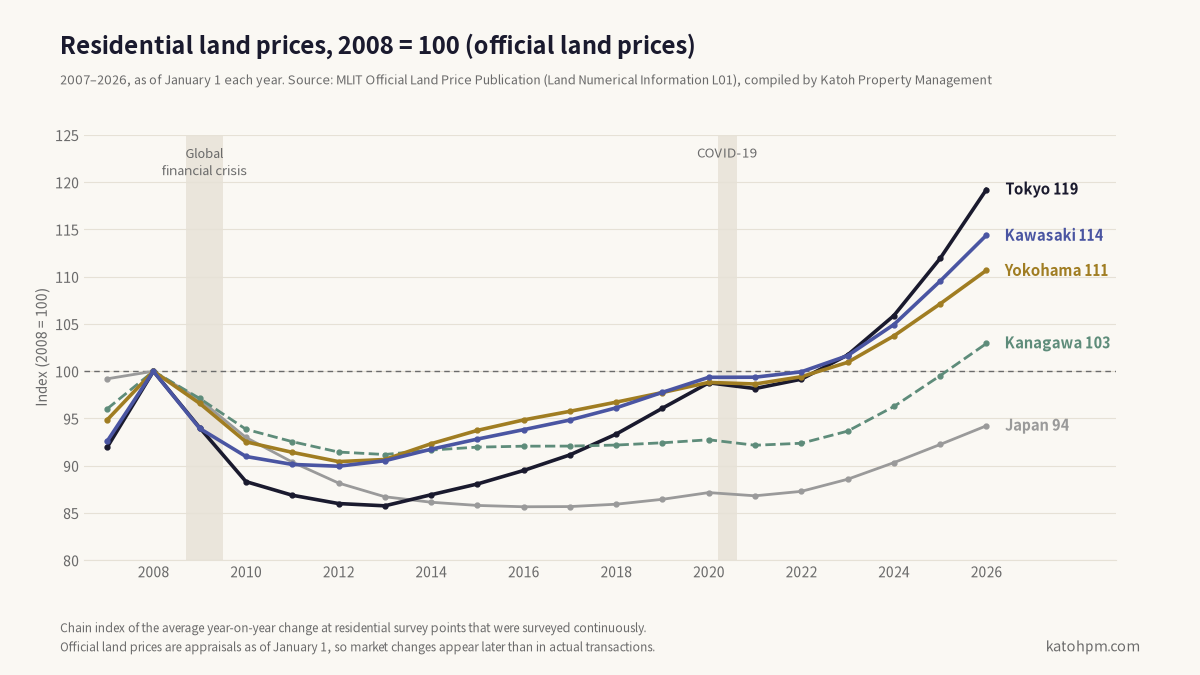
Taking 2008, before the global financial crisis, as 100, resale condominium prices in Tokyo, Kanagawa, Yokohama and Kawasaki reached 200–216 in 2025, roughly double. Detached houses, at 111–129, and residential land, at 103–119, rose far more gently. Using public data from Japan's Ministry of Land, Infrastructure, Transport and Tourism, this article compares how far each fell after the 2008 financial crisis and the COVID-19 shock, and how many years it took to return to the earlier level.
How much have prices risen since before the 2008 financial crisis?
Taking 2008 as 100, resale condominiums in Tokyo, Kanagawa, Yokohama and Kawasaki reached 200–216, roughly double. Detached houses were at 111–129 and residential land at 103–119, a much gentler rise. Over the same 18 or so years, only condominiums grew sharply.
| Area | Resale condominiums (2H 2025) | Detached houses (2H 2025) | Residential land (2026) |
|---|---|---|---|
| Tokyo | 216 | 129 | 119 |
| Kanagawa | 203 | 111 | 103 |
| Yokohama | 202 | 116 | 111 |
| Kawasaki | 200 | 116 | 114 |
2008 (first half of 2008 for condominiums and houses) = 100
The condominium and house figures are our estimates based on the ministry’s transaction price data. Because we compare properties after adjusting for building age, size and municipality, they exclude the effect of “prices look higher because newer properties happened to sell”. Land prices are the residential category of the ministry’s official land prices (地価公示). Every area is calculated from the same data with the same method.
How far did each fall in the 2008 financial crisis, and how many years did it take to recover?
Resale condominiums bottomed out in the first half of 2009 and returned to their earlier level within a few years. Detached houses and land kept falling until 2012–2013 and took about 13–15 years to recover.
| Area | Resale condominiums | Detached houses | Residential land |
|---|---|---|---|
| Tokyo | Bottom 1H 2009 (−7.5%) → recovered 2H 2013 | Bottom 2H 2012 (−15.1%) → recovered 1H 2021 | Bottom 2013 (−14.2%) → recovered 2023 |
| Kanagawa | Bottom 1H 2009 (−9.7%) → recovered 2H 2010 | Bottom 2H 2013 (−15.3%) → recovered 1H 2022 | Bottom 2013 (−8.8%) → recovered 2026 |
| Yokohama | Bottom 1H 2009 (−9.8%) → recovered 1H 2010 | Bottom 2H 2013 (−12.9%) → recovered 2H 2021 | Bottom 2012 (−9.6%) → recovered 2023 |
| Kawasaki | Bottom 1H 2009 (−11.6%) → recovered 1H 2010 | Bottom 2H 2012 (−17.4%) → recovered 1H 2022 | Bottom 2012 (−10.0%) → recovered 2023 |
Declines are measured against 2008 (the first half of 2008 for condominiums and houses)
Condominiums in Kanagawa, Yokohama and Kawasaki passed their 2008 level once in 2010, dipped slightly through 2012, and have stayed above it since the first half of 2013. Even so, there is a clear difference between condominiums, which recovered within one to four years of the bottom, and houses and land, which took four to five years just to reach the bottom.
Note that land prices in January 2008 were at the peak of a period when investment money, including from overseas, had pushed them up. Because the comparison starts from a high point, the recovery of land looks long. Official land prices are also appraisals as of January 1, so they move later than actual transactions.
Did prices fall in the COVID-19 shock?
Hardly at all. Every type fell by less than 2% and returned to its earlier level within a year.
| Decline | Recovered | |
|---|---|---|
| Resale condominiums | 0 to −1.8% in 2H 2020 | 1H 2021 |
| Detached houses | No decline, or less than 1% | 1H 2021 |
| Residential land | 0 to −0.6% in 2021 | 2022 (2023 for Kanagawa as a whole) |
If anything, the COVID-19 shock was the start of a rise. In the charts, both condominiums and houses climbed faster from 2021. This is also when detached houses clearly moved above their 2008 level.
Why did only condominiums grow so much?
This data cannot pin the reason down to one cause, but several factors specific to condominiums likely overlapped.
- Location. Condominiums are often built in convenient places, near stations or in city centers. When such places become more popular, condominiums feel the full effect. The residential points in the official land prices are average residential areas, including places far from stations.
- Rising new condominium prices. Higher construction and land costs pushed up the price of new condominiums, and buyers priced out of new units moving to resale ones is said to have pushed resale prices up too.
- Changing buyers. The tendency of dual-income households to choose condominiums near stations for easy commuting, and a long period of low mortgage rates, also made condominiums easier to buy.
None of these has been verified with this data. However, because prices still roughly doubled after adjusting for building age and size, the rise cannot be explained only by “more new condominiums”.
Why do detached houses move like land?
Because land makes up much of a detached house’s price. A building loses value as it ages, so the price movement of a detached house comes close to that of its land.
In the charts, detached houses and land prices in Tokyo, Yokohama and Kawasaki line up closely, both in when they bottomed out (2012–2013) and in when they returned to their 2008 level (2021–2023). A condominium owner’s share of land is small, and the location, building and management weigh heavily on the price, so condominiums move differently from land.
Why does it matter that land prices across Japan have not recovered?
Because “property always recovers in the end” holds only for cities such as Tokyo, Yokohama and Kawasaki. Residential land prices across Japan kept falling until 2016, and in 2026 they are still 94% of the 2008 level.
Within Japan, the gap between areas where people gather and areas where they do not has widened considerably. Even within Kanagawa, Yokohama and Kawasaki passed their 2008 level in 2023, while the prefecture as a whole only did so in 2026. Kawasaki is one of the areas that bottomed out earlier than Japan as a whole after the 2008 crisis and recovered sooner.
How should people thinking of selling or buying read this?
Condominiums and houses or land have moved completely differently over these 18 years. It is important to look at data separately for the type of property you own or are looking for.
- If you are thinking of selling a condominium: a level roughly double that of 2008 is the highest in these 18 years. On the other hand, closed prices of resale condominiums in Tokyo’s 23 wards have been below the previous year since August 2026. Whether you can sell at today’s price is best checked against recent closed transactions near the same station and in the same building age band.
- If you are thinking of selling a house or land: prices have risen only gently over these 18 years, but in the 2008 crisis they fell further than condominiums and took 13–15 years to recover. Timing the sale around your plans for your next home is more realistic than waiting for prices to rise.
- If you are thinking of buying: in the 2008 crisis, condominiums fell by around 10% and recovered within a few years, and in the COVID-19 shock they hardly fell at all. Past data gives little support to the idea of waiting for a big fall.
In our valuations and proposals, we narrow down the ministry’s public data by building age and area, and show you the underlying data as it is. For help with selling or buying, see our pages for sellers and buyers.
Sources: MLIT Real Estate Information Library, transaction price data (third quarter of 2005 to fourth quarter of 2025), and the Official Land Price Publication (Land Numerical Information L01, 2026). The condominium, house and land price indexes are our own calculations. This English article is a translation for reference; the Japanese version is the original.