Did resale condo prices fall in Tokyo's 23 wards? A comparison with Yokohama and Kawasaki (Reading the September 2026 data)
In September 2026, the closed price per square meter of resale condominiums in Tokyo's 23 wards was ¥1,303,900, down ¥11,500 (−0.9%) from a year earlier, the second straight year-on-year fall after August's "first fall in 76 months". Using East Japan REINS data for September, this article compares the five districts of the 23 wards (central 3 wards, Joto, Jonan, Josai, Johoku) with Yokohama and Kawasaki by year-on-year changes in price per square meter, average building age and number of transactions. Much of the decline can be explained by older buildings and a shift in which districts sold, and Yokohama and Kawasaki are at roughly the same level as a year earlier.
Units: Japanese statistics express prices in 万円 (units of ¥10,000). In this article, ¥1,303,900 per square meter corresponds to 130.39万円 in the Japanese original.
Did resale condo prices fall in Tokyo’s 23 wards in September 2026?
The closed price per square meter in the 23 wards in September was ¥1,303,900, down ¥11,500 (−0.9%) from a year earlier, the second straight year-on-year fall. But of the five districts, only two, the central 3 wards and Josai, went down; the other three went up. Much of the decline can be explained by more sales of older buildings.
The figures come from Market Watch, the monthly bulletin published by the East Japan Real Estate Information Network (East Japan REINS, 東日本不動産流通機構). In the previous month’s August edition, the 23 wards recorded their “first fall since April 2020, the first in 76 months”, which drew attention, and the September edition continued the trend.
| Area | Price per m² | Year-on-year change | Average building age | Age change | Change in transactions |
|---|---|---|---|---|---|
| Greater Tokyo area | ¥810,700 | −¥41,100 (−4.8%) | 28.53 years | +2.27 years | −1,018 |
| Tokyo 23 wards | ¥1,303,900 | −¥11,500 (−0.9%) | 27.31 years | +2.64 years | −610 |
| Central 3 wards (Chiyoda, Chuo, Minato) | ¥2,311,700 | −¥36,900 (−1.6%) | 21.80 years | +1.72 years | −114 |
| Joto (Taito, Koto, Edogawa, Sumida, Katsushika, Adachi, Arakawa) | ¥1,027,500 | +¥9,300 (+0.9%) | 25.26 years | +2.87 years | −224 |
| Jonan (Shinagawa, Ota, Meguro, Setagaya) | ¥1,277,100 | +¥37,300 (+3.0%) | 28.79 years | +0.86 years | −100 |
| Josai (Shinjuku, Shibuya, Suginami, Nakano) | ¥1,486,100 | −¥81,000 (−5.2%) | 31.15 years | +3.73 years | −91 |
| Johoku (Bunkyo, Toshima, Kita, Itabashi, Nerima) | ¥1,074,600 | +¥40,800 (+3.9%) | 28.80 years | +2.73 years | −81 |
Source: East Japan REINS, “Market Watch”, September 2026
Josai, which fell the most, was a month in which the average building age rose by 3.73 years, from 27.42 to 31.15. In East Japan REINS’s annual report, the price per square meter of resale condominiums in the greater Tokyo area drops by more than ¥200,000 between buildings aged 26–30 years and 31–35 years (see the age-band table in last month’s article), and Josai’s average building age crossed exactly that boundary. It is not possible to separate how much of the −5.2% comes from building age, but it is premature to read it simply as “condos in Josai lost 5% of their value”.
The other notable point is the fall in transactions. The 23 wards had 1,385, 610 (−30.6%) fewer than a year earlier, the ninth straight monthly decline. When transaction numbers fall sharply, the average is more easily moved by which districts and which building ages happened to sell.
What was August’s “first year-on-year fall in 76 months”?
In August, the closed price per square meter in the 23 wards was ¥1,326,900, ¥4,100 (−0.3%) below a year earlier. In the same month, however, all five districts rose year on year. What pulled the overall average down was a sharp drop in transactions in the high-priced central 3 wards. The decline was 0.3%, and REINS itself described it as “almost flat”.
| District | Price per m² (August 2026) | Year-on-year change | Closed transactions (last year → this year) |
|---|---|---|---|
| Central 3 wards | ¥2,468,100 | +¥97,200 (+4.1%) | 252 → 154 |
| Joto | ¥1,006,600 | +¥23,000 (+2.3%) | 453 → 359 |
| Jonan | ¥1,284,300 | +¥19,800 (+1.6%) | 355 → 280 |
| Josai | ¥1,530,100 | +¥56,100 (+3.8%) | 253 → 213 |
| Johoku | ¥1,095,000 | +¥55,700 (+5.4%) | 280 → 259 |
| 23 wards overall | ¥1,326,900 | −¥4,100 (−0.3%) | 1,593 → 1,265 |
Source: East Japan REINS, “Market Watch”, August 2026
All five districts rose, yet the whole fell. Because the central 3 wards’ price per square meter is roughly twice that of the other districts, a fall in their share of transactions alone lowers the 23-ward average. In August, the central 3 wards’ share was 12.2%, down 3.6 points from 15.8% a year earlier and the lowest in the 13 months. In September it was 12.7%, a smaller gap from a year earlier (14.5%) than in August.
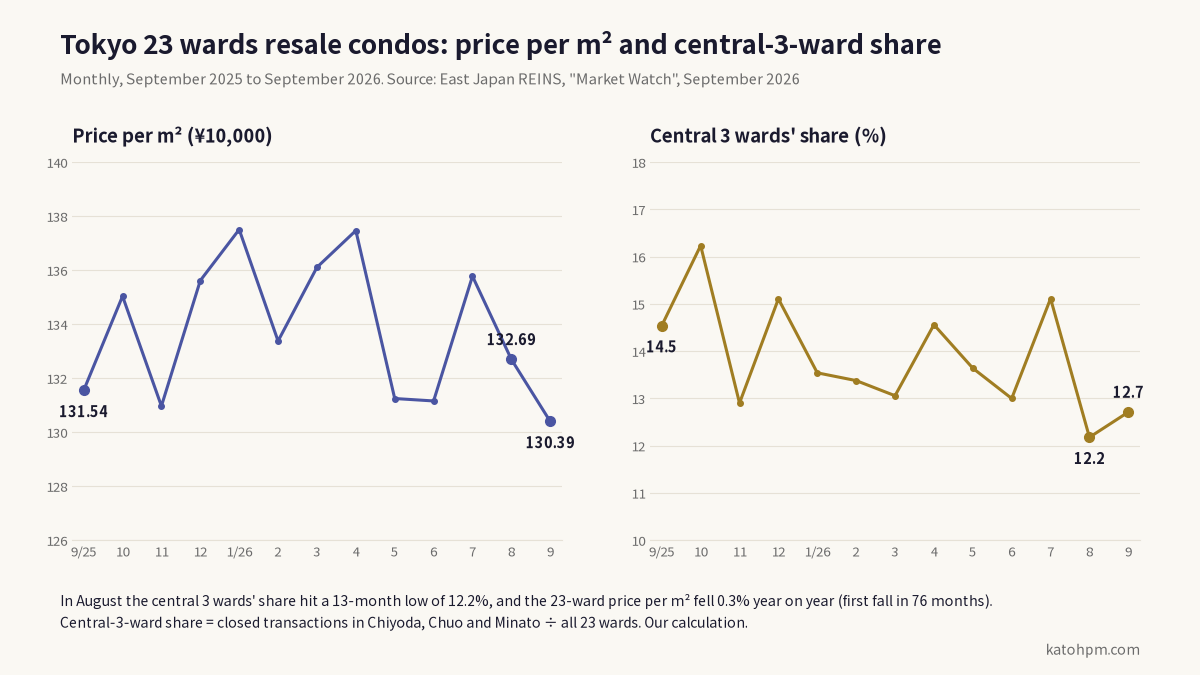
Last month’s article, “Kawasaki resale condo prices fell 7.3% year on year per square meter. Did they really drop?”, showed that the average price falls when the condominiums sold are older. In the 23 wards in August, the same thing happened through the mix of districts.
How do Yokohama and Kawasaki compare with Tokyo’s 23 wards?
In September, Yokohama was ¥635,800, up ¥6,700 (+1.1%) year on year, and Kawasaki was ¥721,900, up ¥1,100 (+0.1%), both roughly the same as a year earlier. Over the same year, the average building age rose by 2.22 years in Yokohama and 3.07 years in Kawasaki, so allowing for building age, prices can be read as firm.
| Area | Price per m² | Year-on-year change | Average building age | Age change | Change in transactions |
|---|---|---|---|---|---|
| Tokyo 23 wards | ¥1,303,900 | −¥11,500 (−0.9%) | 27.31 years | +2.64 years | −610 |
| Yokohama and Kawasaki | ¥663,900 | +¥7,900 (+1.2%) | 29.24 years | +2.35 years | −112 |
| Yokohama | ¥635,800 | +¥6,700 (+1.1%) | 30.46 years | +2.22 years | −101 |
| Kawasaki | ¥721,900 | +¥1,100 (+0.1%) | 26.72 years | +3.07 years | −11 |
| Rest of Kanagawa (outside Yokohama and Kawasaki) | ¥465,500 | +¥48,600 (+11.7%) | 27.20 years | −2.00 years | −51 |
Source: East Japan REINS, “Market Watch”, September 2026
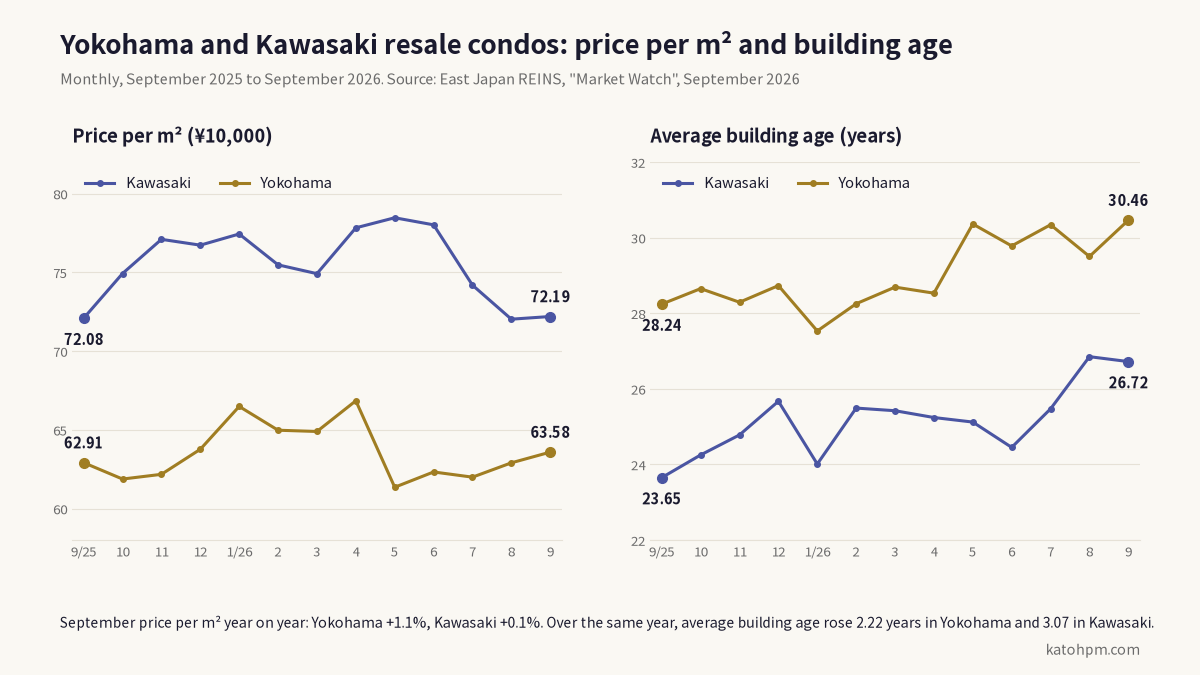
Kawasaki fell sharply in August, −7.3% year on year, but in September it was back to roughly the same level as a year earlier. The average building age stayed old, 26.85 years in August and 26.72 years in September, and yet the price returned to last year’s level. This supports the view in last month’s article that, setting aside the change in building age, Kawasaki’s prices were firm.
The fall in transactions also differs from the 23 wards. While the 23 wards fell 30% from a year earlier, Yokohama fell 18.6% and Kawasaki only 4.9%.
How should the “rest of Kanagawa +11.7%” be read?
This is the figure for Kanagawa outside Yokohama and Kawasaki (Sagamihara, the Shonan area, central Kanagawa and so on), and it is the only category whose average building age became younger, by 2.00 years. It was a month in which more newer buildings sold, exactly the opposite of Kawasaki last month (3 years older, −7.3%).
With only 255 transactions, it is also a category that swings a lot from month to month. Some have taken the figure to mean that “Kanagawa keeps rising”, but it should be considered separately from Yokohama and Kawasaki. For prices in Kawasaki, including Musashikosugi, Kawasaki’s own figures are the right ones to look at.
Why does the widening gap between asking prices and closed prices matter?
Across the greater Tokyo area, the price per square meter of properties on the market (inventory) is 26.7% higher than a year earlier, while that of properties that closed is 4.8% lower. The gap between what sellers ask and what actually sells is widening.
| Greater Tokyo area (September 2026) | Price per m² | Year on year | Number | Year on year |
|---|---|---|---|---|
| Closed | ¥810,700 | −4.8% | 3,457 | −22.7% |
| New listings | ¥1,180,100 | +16.4% | 17,721 | +15.4% |
| Inventory (on the market) | ¥1,199,700 | +26.7% | 50,450 | +15.1% |
Source: East Japan REINS, “Market Watch”, September 2026
Inventory has risen for seven straight months and closed transactions have fallen for six. The greater Tokyo closed price of ¥810,700 per square meter fell below the level of October 1990 (¥835,000). Properties on the market and properties that closed do not have the same mix of districts and building ages, so the gap cannot be read directly as a discount. Still, it suggests that properties priced high are increasingly left unsold.
How should people thinking of selling or buying read this?
Use monthly averages as a rough guide to direction, and judge your own property by closed transactions near the same station and in the same building age band.
- If you are thinking of selling: there is no need to rush into cutting your price because of the “year-on-year fall” headline for the 23 wards. On the other hand, at a time when inventory is growing and the gap between asking and closed prices is widening, a price above the market is more likely to go unsold. Setting the initial asking price close to recent closed transactions is, in the end, the shortest route to selling quickly at a price you are satisfied with. In our valuations, we narrow down the public transaction price data released by the Ministry of Land, Infrastructure, Transport and Tourism by building age and area, and show you the underlying data as it is.
- If you are thinking of buying: when inventory is growing, there are more properties to choose from and more room to negotiate on price. However, a month with a lower average price is also “a month in which more older or suburban properties sold”, and condominiums near stations or in newer buildings have not necessarily fallen at the same rate.
- For both: Tokyo’s 23 wards and Yokohama/Kawasaki move differently when viewed through average prices. The data you should look at depends on where you buy or sell.
For help with selling or buying, see our pages for sellers and buyers.
Sources: East Japan Real Estate Information Network, “Market Watch” (monthly bulletin). Year-on-year differences and the central 3 wards’ share are our own calculations. The figures cover closed transactions only, so they do not match the price movement of any individual property. Yen amounts are converted from the 万円 figures in the source (130.39万円 = ¥1,303,900). This English article is a translation for reference; the Japanese version is the original.